sb2sep
Separate Stellar Component Spectra and Calculate Radial Velocities in SB2 Binary Systems
Evaluating output
Note: The plots shown are slightly out-dated as of version 1.2.6. Currently, the RV routine shifts the template with the best RV guess to improve the quality of the calculated broadening function. As such, new plots will show all broadening function peaks aligning close to 0 if converged.
The evaluate_ssr_results module provides convenient ways to evaluate the raw data output from the spectral separation routine with similar plots to those provided during routine execution.
Load data
To load the raw data from the routine, the function load_routine_results can be used:
Input arguments:
- folder_path (string). Provides the folder location of the raw output from the spectral separation routine.
- filename_bulk_list (list[string, …]). This should contain a list of filename identifiers, specifically the identifying wavelength intervals. Examples of input: [‘4500_5825’] or [‘4500_4625’, ‘4625_4750’]
Returns:
- routine_results (RoutineResults object). This object can be supplied to the other functions for convenient plotting.
Plotting functions
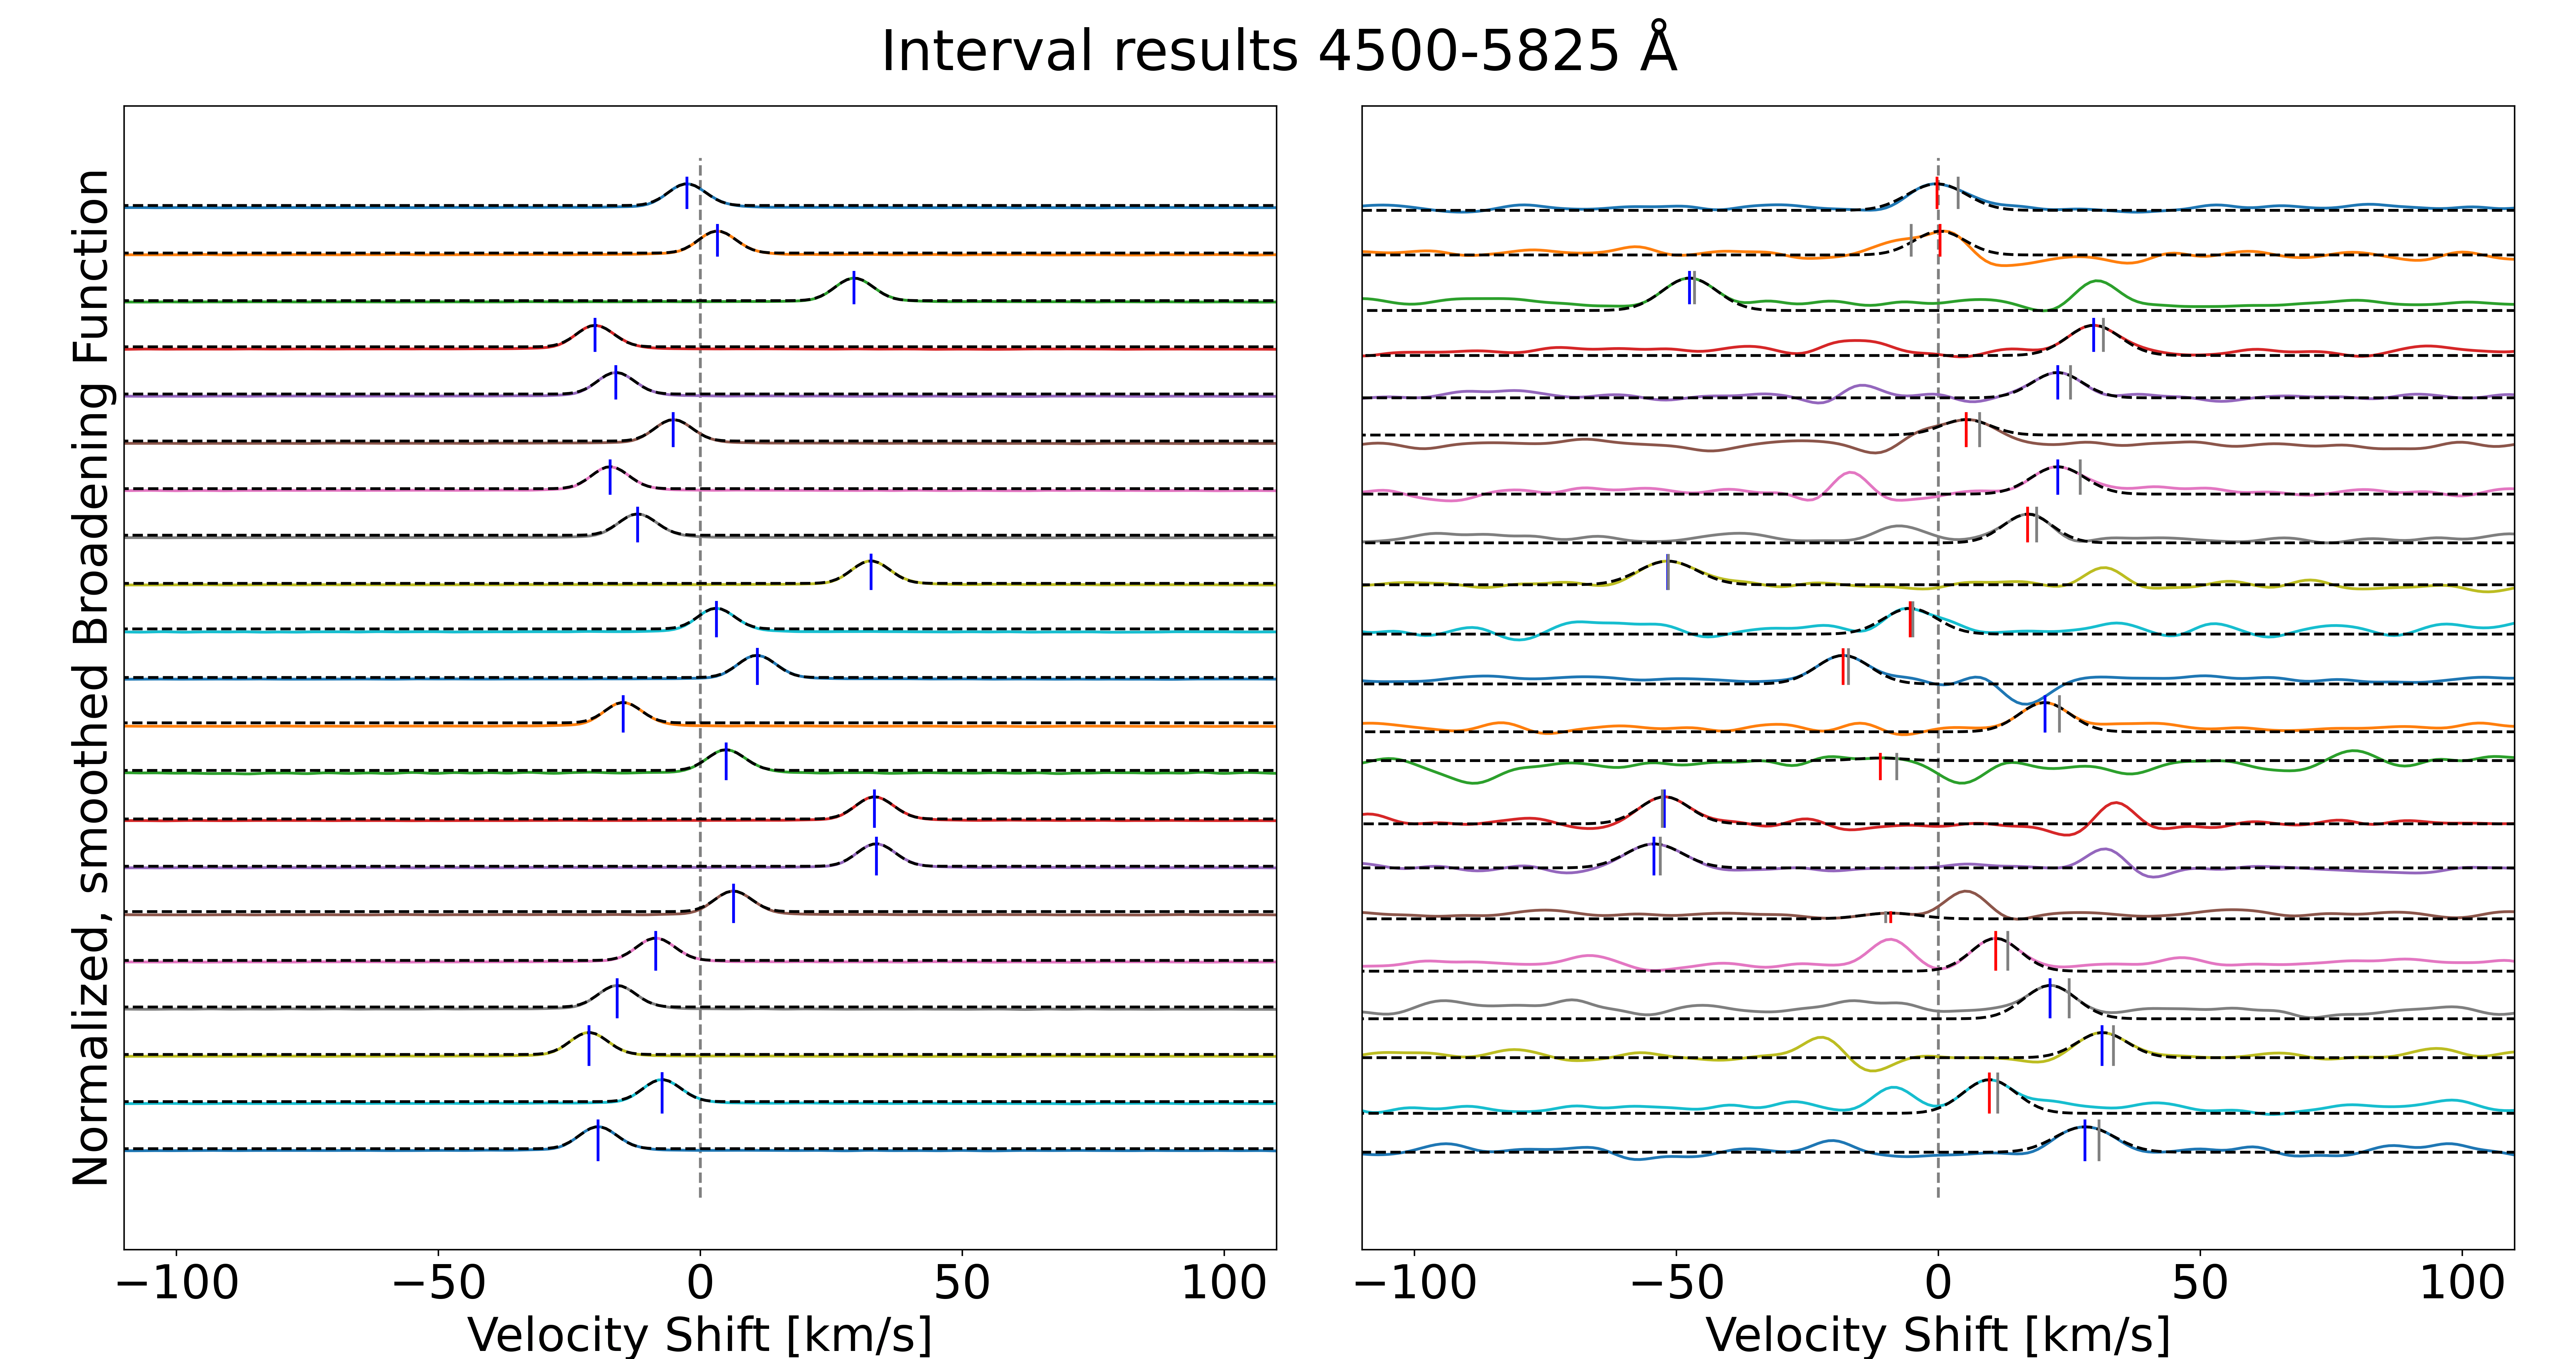
plot_broadening_functions() input:
- evaluation_data (RoutineResults).
- block (bool), Default = False. If True, plt.show(block=True).
- xlim (list[float, float]), Default = None. If provided, plt.xlim(xlim).
- smoothed (bool), Default = True. If True, plots the smoothed broadening functions. If False, unsmoothed.
This function will create a single figure for each wavelength interval provided.
Example broadening function plot:

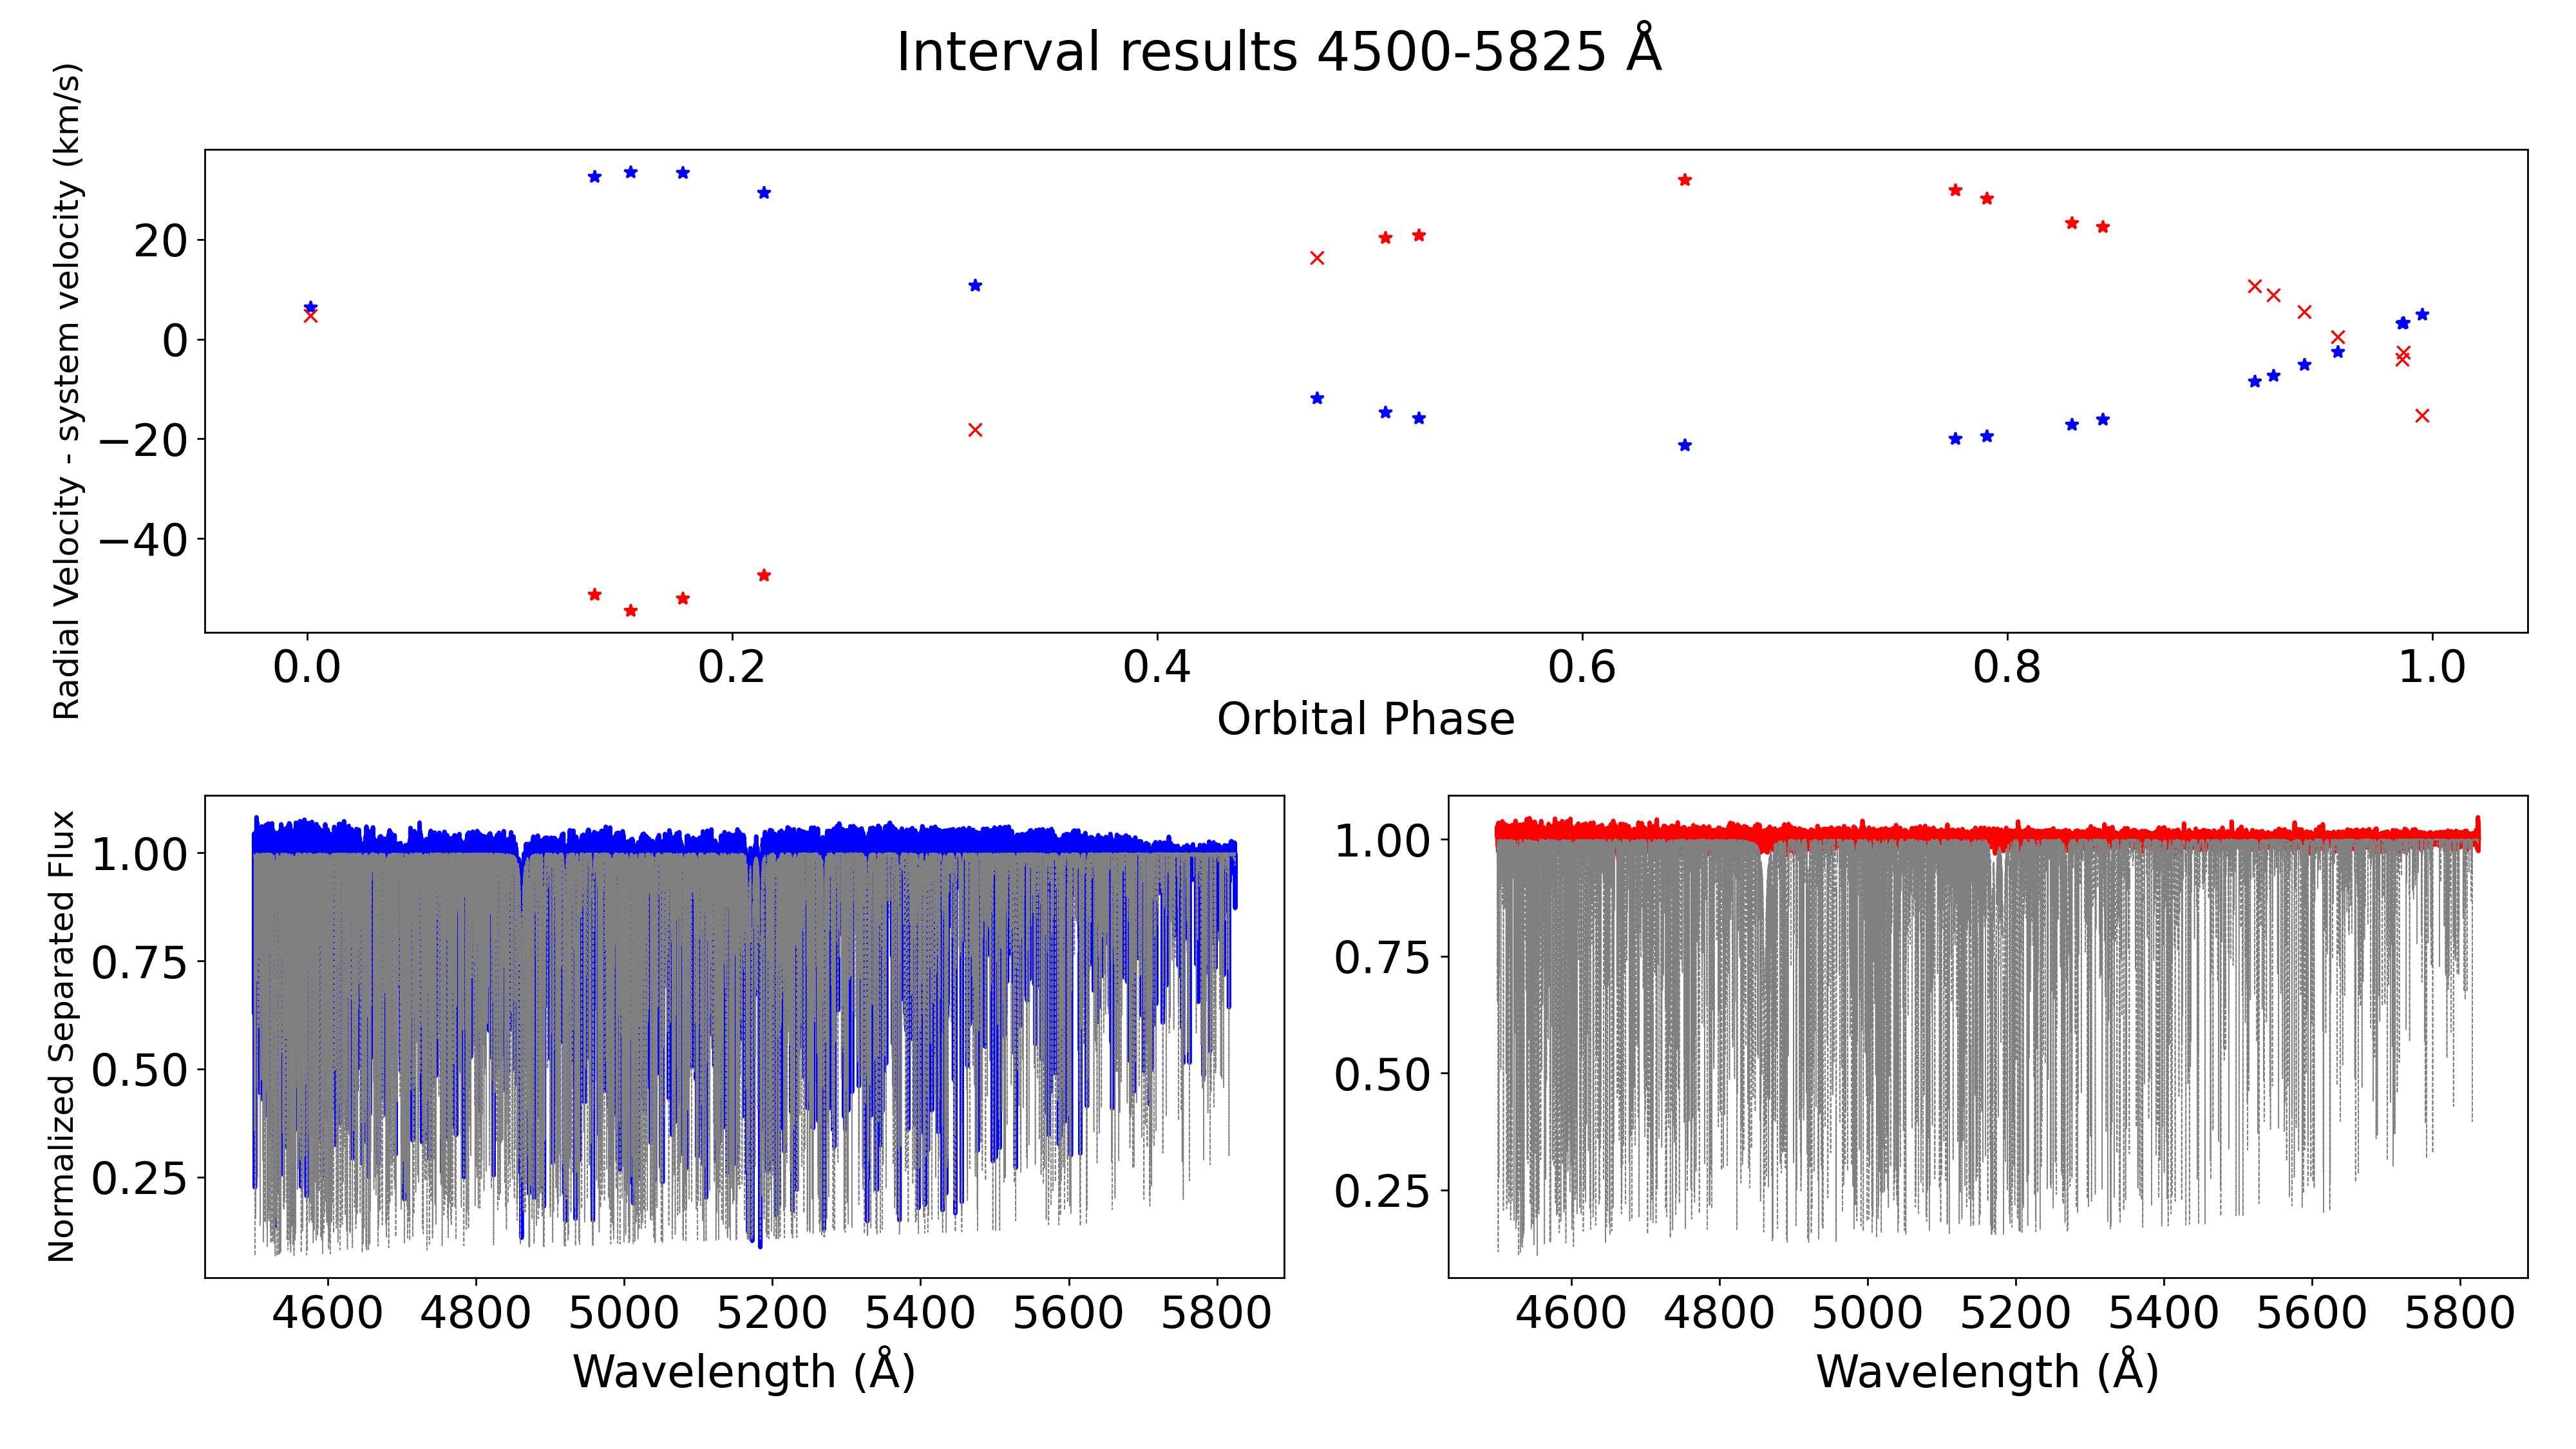
plot_rv_and_separated_spectra() input:
- evaluation_data (RoutineResults).
- period (float).
- block (bool), Default = False.
- color_A (string), Default = ‘b’. Matplotlib colors.
- color_B (string), Default = ‘r’.
- fig (matplotlib figure), Default = None. If provided, will overplot on the previously used figure.
- axs (list[matplotlib axes]), Default = None. If provided, will overplot on the previously used axes.
Returns: fig, ax1, ax2, ax3
Example rv plot:
